Run the business
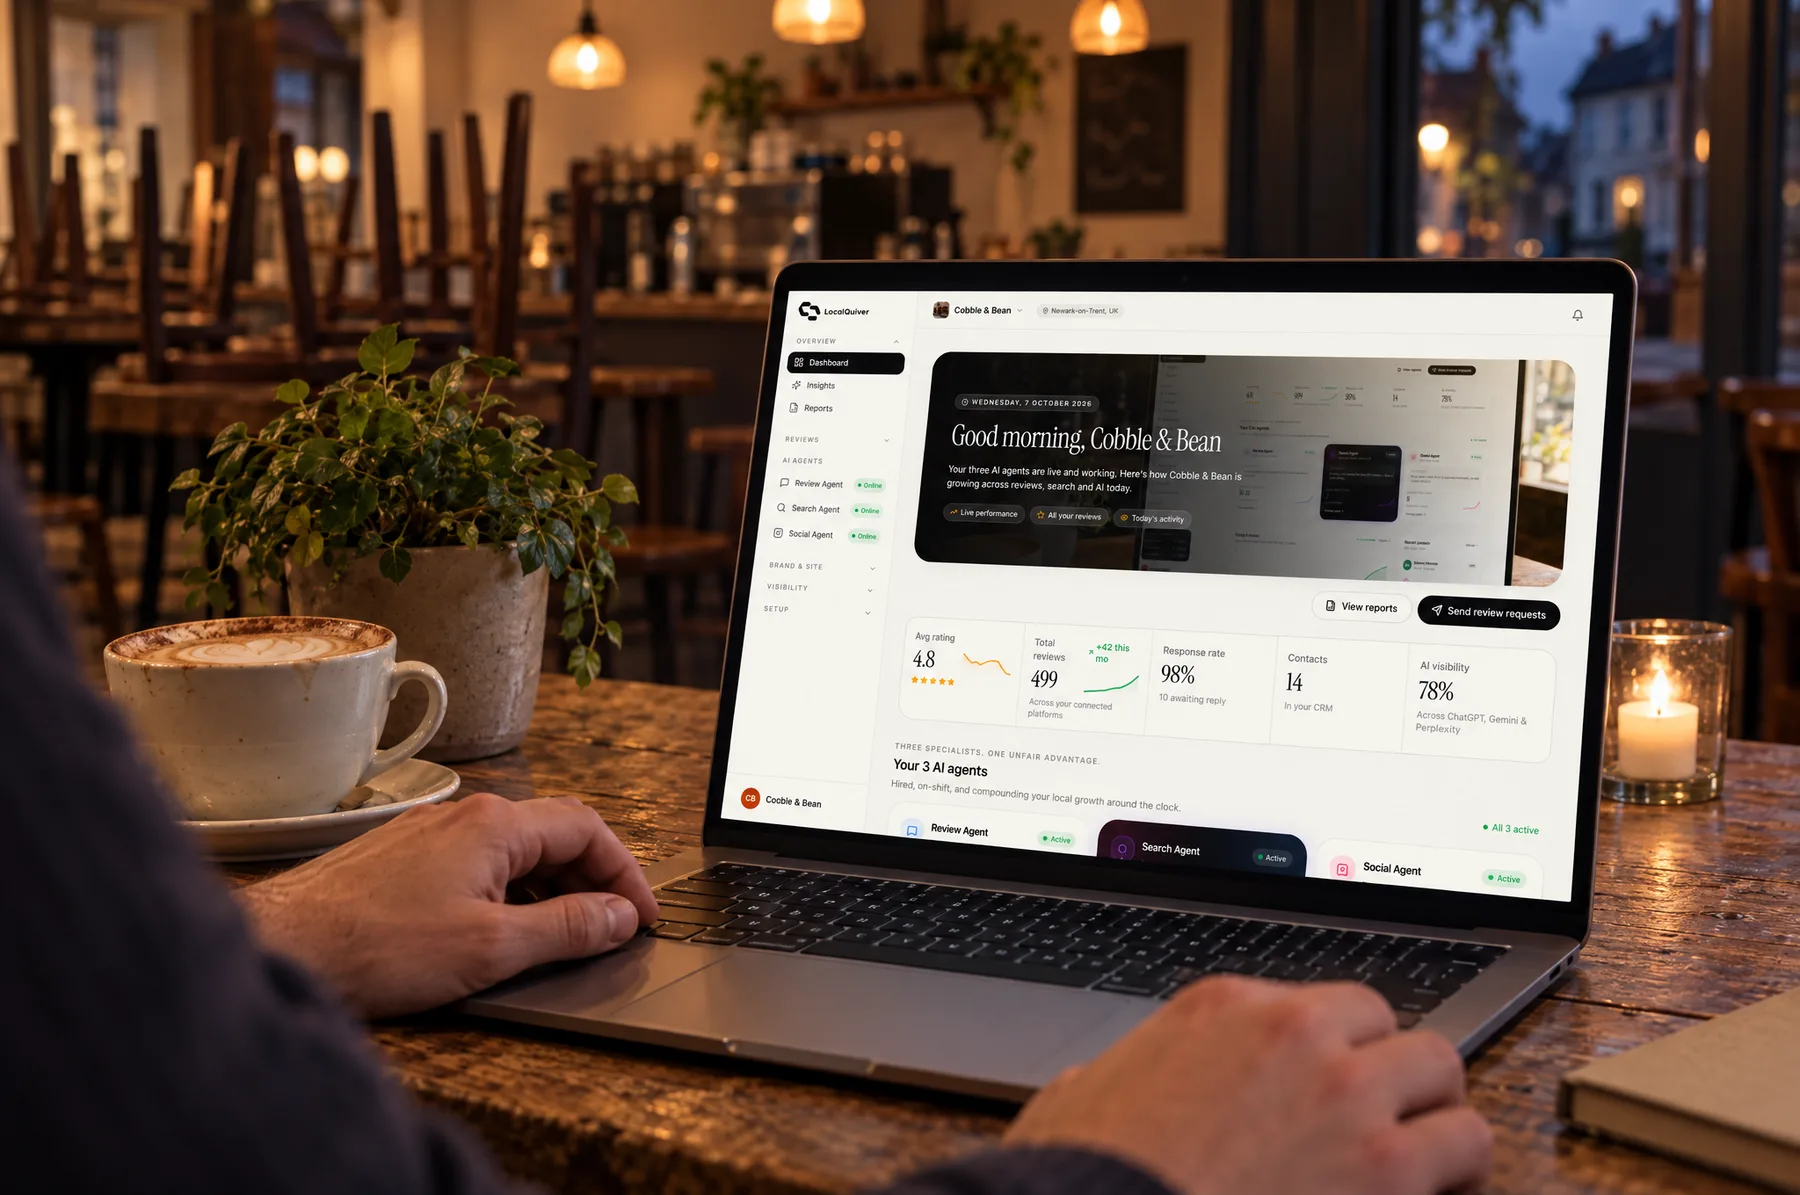
One dashboard shows your rating, reviews, response rate and what each agent has been doing. Every Monday a fresh summary sets out what customers love and what could be better, and on the 1st of each month a clear report is waiting in your dashboard, with a PDF to download.
Monthly report
September 2026
What changes
Your month at a glance
Average rating, total reviews, response rate, contacts and your AI-visibility score sit on one screen, with a 12-week review trend and your latest reviews. You can tell in a minute whether things are moving.
Hear what customers really say
Insights reads your latest 50 reviews and writes a plain summary of what people love and what’s worth fixing, rewritten every Monday. The rating split and a platform-by-platform comparison show where you stand.
Numbers you can trust
Every figure in the monthly report is counted from your own dated records: reviews, requests, link clicks, map rank, articles and posts. Nothing is estimated, so a quiet month reads as a quiet month.
The film
A tour of the LocalQuiver dashboard, the Monday Insights summary of the latest 50 reviews, and the monthly report created on the 1st that waits in the dashboard with a PDF to download.
Read the transcript
0:02Is your marketing actually working? Without clear numbers, it's hard to tell.
0:07Your dashboard shows it at a glance: your rating, total reviews, response rate, contacts and AI visibility, with a 12-week review trend and your latest reviews.
0:18And you can see whether each agent is online or manual, and what it's been doing lately.
0:23Every Monday, Insights reads your latest 50 reviews, and sums up what customers love, and what's worth fixing.
0:31Then, on the first of each month, last month's report is waiting in your dashboard.
0:35Reviews by platform, response rate, requests and link clicks, map rank, AI visibility, articles and social posts, each against last month.
0:45Plus up to three wins, up to three things to focus on, and your best reviews of the month.
0:52Every figure is counted from your own records. Nothing's estimated, so you always know where you stand.
0:59LocalQuiver. Your marketing, sorted.
Open “A clear report, every month” on its own page →Browse all our films →
How it works
- 01Everything is recordedEach review, request, link click, article and post is logged with its date as your agents work, so there’s nothing for you to fill in or keep up to date.
- 02Check in any timeOpen the dashboard whenever you like to see your rating, reviews and response rate, whether each agent is online or manual, and what it’s done lately.
- 03Insights every MondayA fresh AI summary of your latest 50 reviews is written every Monday, or whenever you ask for one, with the rating split and weekly trend beside it.
- 04Your report on the 1stOn the 1st, last month’s report is created and waiting in your dashboard: up to three wins, up to three things to focus on, the best reviews, and a PDF to download.
What's included
- Rating, reviews, response rate, contacts and AI visibility on one screen
- A 12-week review trend and your latest reviews
- A Monday AI summary of what customers love and what to fix
- Rating split, positive share and platform comparison
- A monthly report created on the 1st, waiting in your dashboard
- Reviews by platform, response rate, requests and link clicks
- Map rank and AI visibility, where your plan includes them
- Articles and social posts, with change against last month
- Up to three wins and three things to focus on
- A downloadable PDF, with earlier months a click away
By industry
The same feature works differently for a pub than a plumber. See how it works for yours.
In your dashboard. It’s created on the 1st for the month just finished and waits there, with a PDF to download, print or keep. Earlier months are one click away, so you can look back and see how things have moved whenever you like.
No. It covers reviews by platform, response rate, review requests and link clicks, map rank, AI visibility, articles and social posts. If we built your website, visits show in its own analytics, and enquiries sit in your inbox, so the report sticks to what it can count properly.
No. It shows what actually happened, counted from real records: requests sent, links clicked, reviews in, map rank and posts out. It doesn’t guess at revenue or credit a review to a particular message, because nobody can see that reliably.
The report compares you with yourself: this month against last. There are no industry averages to chase. To see how you stack up against named local rivals, competitor tracking checks their reviews, replies and map position every month.
Your latest 50 reviews. It picks out what customers love and what’s worth fixing, in plain English, and it’s rewritten every Monday, or whenever you ask for a fresh one. It sits in Insights beside your rating split, weekly trend and platform comparison.
Book a free, no-pressure chat and we'll show you how reports & insights would work for your business, set up and running for you.